12.4 - Reading Graphs & Drawing Conclusions
Reading a value off the graph
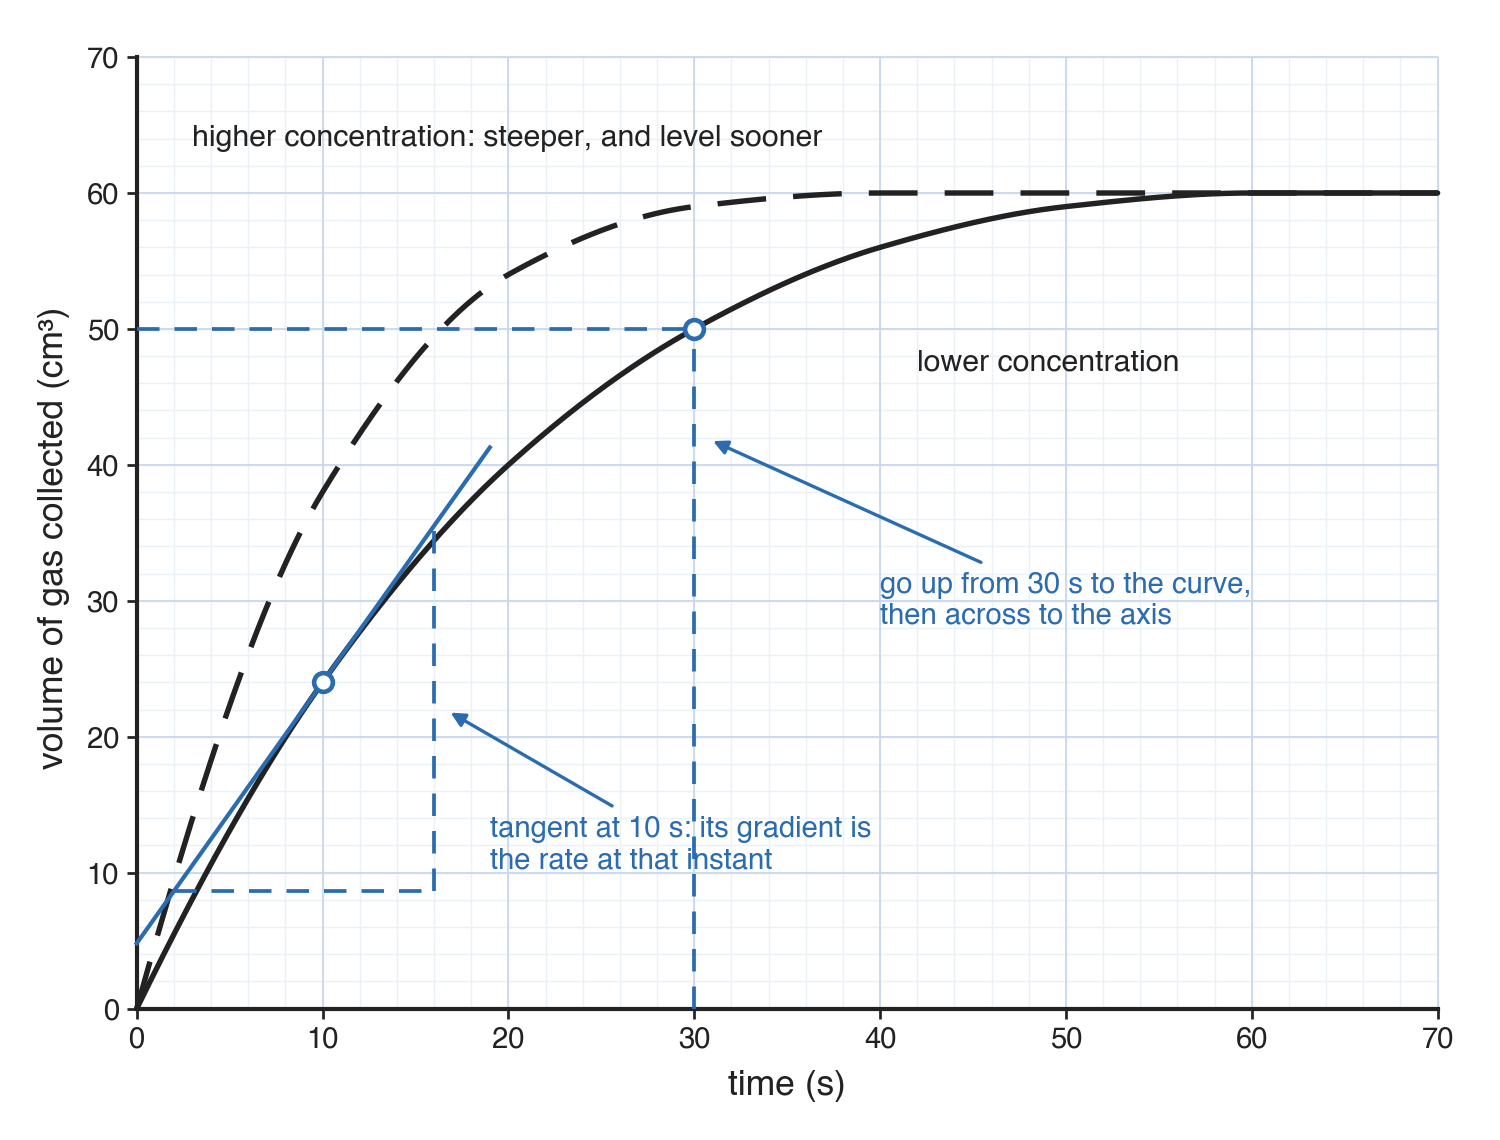
- To read off a value (e.g. the volume of gas at 30 seconds): go up from 30 s on the x-axis to the curve, then across to the y-axis and read off the value.
- Always draw both dashed construction lines on the graph to show where your number came from.
Interpolation vs extrapolation
- Interpolation - Reading a value between your plotted points.
- Extrapolation - Estimating a value beyond your plotted points by extending the line. Avoid this unless asked, because you can't be sure the curve continues the same way.
Describing a trend
A complete trend answer needs three things: the direction of the graph, figures from the axes to back it up, and any change (such as where the curve levels off).
As [independent variable] increases, [dependent variable] increases (or decreases), from [figure] to [figure], then levels off at [value].
Example: "As time increases, the volume of gas increases quickly at first, from 0 to about 40 cm3 in the first 20 seconds, then more slowly, before levelling off at 60 cm3 once the reaction has finished."
Directly proportional relationships
- A relationship is only directly proportional when its graph is a straight line through the origin (doubling one variable doubles the other).
- A curve, or a straight line that does not pass through the origin, is not directly proportional, even if it rises steadily.
Drawing a conclusion
- A conclusion states how the independent variable affects the dependent variable.
- It always names both variables and states how they change together:
As the [independent variable] increased, the [dependent variable] increased (or decreased).
- Example: "As the concentration of the acid doubled, the mean rate roughly doubled."
- Where the data supports it, include numbers to describe the relationship rather than just giving a direction.
Match the conclusion to the data
- A conclusion must only describe what the data actually shows.
- Don't extend the conclusion beyond the range of values tested, and only claim a mathematical relationship (like doubling) if all your results support it.
What a conclusion is not
- Not a single reading - Stating one value (e.g. "the rate was 2.5 cm3/s") doesn't link the two variables.
- Not an explanation - A conclusion states what happened (the rate increased as concentration increased), not why (which requires collision theory).
TermDefinition
InterpolationReading a value from a graph between the plotted points.
ExtrapolationReading a value from a graph beyond the range of the plotted points, by extending the line.
Directly proportionalA relationship between two quantities where doubling one doubles the other, so their graph is a straight line through the origin.
Key points to remember
How were these notes?