3.2 - Solubility & Solubility Curves
Solubility and solubility curves
- The solubility of a solid is the mass of it that dissolves in 100 g of water at a stated temperature to form a saturated solution.
- A solubility curve is a graph plotting solubility against temperature.
How temperature affects solubility
- For most solids, solubility increases as temperature increases.
- For gases, solubility decreases as temperature increases.
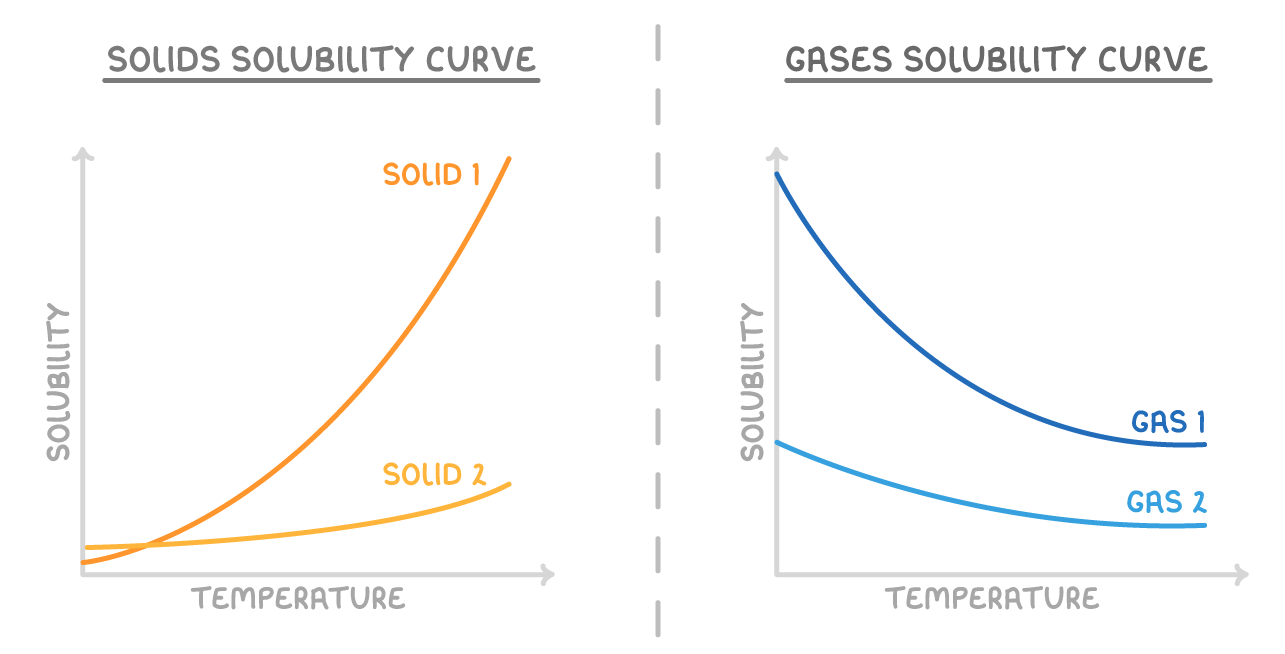
Solubility changes much more with temperature for some substances than for others.
Calculating solubility from experimental data
- Add excess solid to a known mass of water at a set temperature and stir until no more dissolves.
- Filter the mixture, then dry and weigh the undissolved solid left on the filter paper.
- Mass of solute dissolved = mass added − mass of dried excess.
Formula for solubility
Where:
- Solubility is in grams of solute per 100 g of water
- Mass of solute dissolved is in grams (g)
- Mass of water is in grams (g)
Worked example - Solubility from experimental data
30 g of sodium nitrate is added to 25 g of water at 20 °C and stirred well. The mixture is filtered, and the solid left on the filter paper is dried and weighed at 8 g. Calculate the solubility of sodium nitrate at 20 °C.
Step 1 - Find the mass of solute that dissolved
Mass dissolved = 30 - 8 = 22 g
Step 2 - Apply the solubility formula
TermDefinition
SolubilityHow much of a substance dissolves in a solvent. For a solid, it is usually given as the mass that dissolves in 100 g of water at a stated temperature to form a saturated solution.