1.5 - Velocity-Time Graphs
Reading a speed-time graph
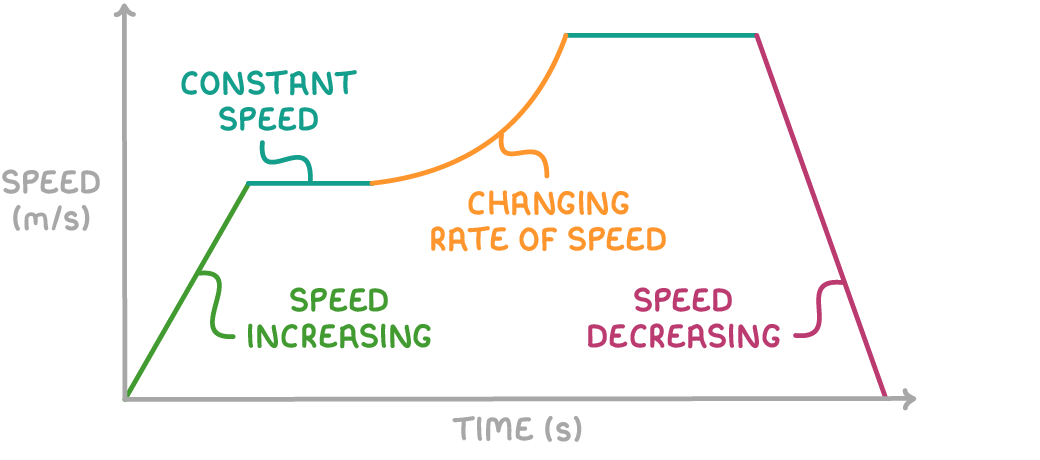
A speed-time graph shows how an object's speed changes as time passes. Speed has no direction, so the line never drops below the time axis.
- A flat section means a steady (constant) speed.
- An uphill section (going up to the right) means the speed is increasing.
- A downhill section (going down to the right) means the speed is decreasing.
- The steeper the line, the faster the speed is changing.
- A straight line means the speed is changing at a steady rate.
- A curve means the rate of change of speed is itself changing.
The gradient gives the rate of change of speed
- The gradient (steepness) of a speed-time graph equals the rate of change of speed - it's the change in speed divided by the time taken.
- For a straight section, divide the change in speed (the rise) by the time taken (the run).
The area gives the distance moved
- The area between the line and the time axis equals the distance moved in that time interval.
- Where the line is straight, split the area into rectangles and triangles, work out each area, and add them together.
Worked example - Rate of change of speed and distance
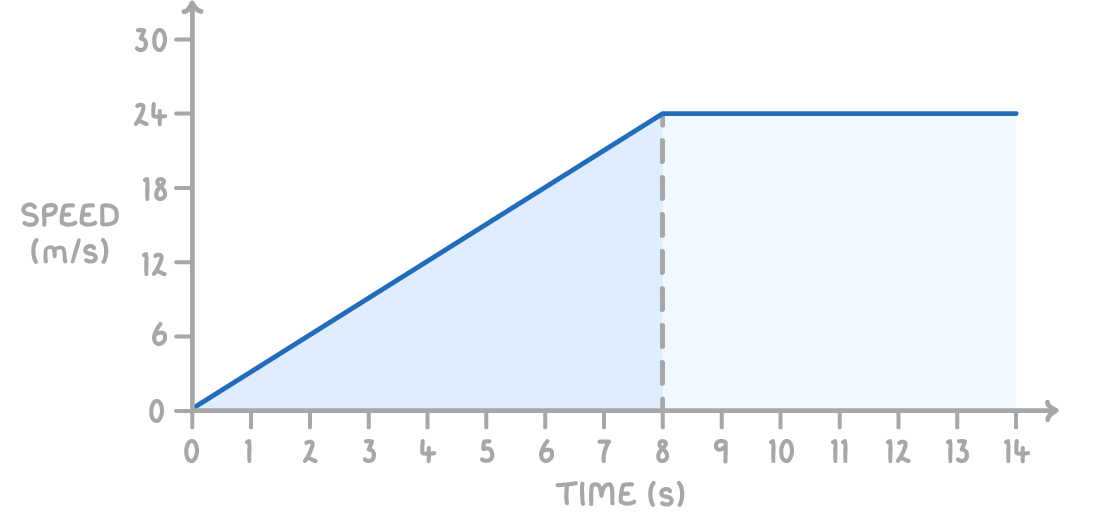
A speed-time graph shows a car's journey. The speed rises in a straight line from 0 to 24 m/s over the first 8 s, then stays constant at 24 m/s. Find the rate of change of speed over the first 8 s, and the distance the car moves in the first 14 s.
Step 1 - Find the change in speed and the time
Change in speed = 24 − 0 = 24 m/s
Time taken = 8 s
Step 2 - Divide the change in speed by the time
Rate of change of speed is the gradient over the first 8 s:
Rate of change of speed = 24 ÷ 8 = 3 m/s2
Step 3 - Find the distance as the area under the graph
The distance for the first 14 s is the area under the graph. Split it into a triangle (first 8 s) and a rectangle (next 6 s):
Triangle = ½ × base × height = ½ × 8 × 24 = 96 m
Rectangle = width × height = 6 × 24 = 144 m
Step 4 - Add the areas together
Distance = 96 + 144 = 240 m