3.12 - Economic Inequality
Economic inequality, income and wealth
Economic inequality refers to the uneven spread of income and wealth across a population. It highlights differences in financial resources available to various groups within society.
Economic inequality
Economic inequality is the uneven allocation of income and wealth among individuals or households.
Household income
Household income is the total payments a household receives over a set period from using factors of production, including rent from property, wages from employment, interest from savings, and profit from business activities.
Wealth
Wealth is the net value of what a household owns at a particular moment, calculated as the worth of assets minus any debts owed. Assets can include items like bank savings, shares, bonds, properties, vehicles, and other valuables.
Inequality in income and wealth
Income and wealth are related but separate ideas. For instance, someone who has retired might possess considerable wealth from owning a valuable property but receive only a small regular income.
Key differences between income and wealth
- Households can draw on wealth to spend more than their current income allows, or they might spend less than they earn to build up their wealth over time.
- On average, wealth tends to exceed income. Data from 2016 across Organisation for Economic Co-operation and Development (OECD) countries showed average household income at $25,908 annually, while average net household wealth reached $67,139.
Patterns of inequality in income and wealth
- Wealth shows greater inequality than income. In OECD nations, the level of wealth inequality is typically double that of income inequality.
- Wealth can produce additional income, meaning that growing wealth gaps often lead to wider income gaps as well.
- In the USA, wealth inequality is the highest in the OECD, with the top 10% of households holding the great majority of total wealth, while the bottom 40% hold under 5%.
- Wealth inequality is lowest in countries like Japan, Poland, Greece, and Belgium, where the top 10% own less than half of total wealth, roughly half the share the top 10% own in the USA.
- Some nations with high wealth inequality, such as the Netherlands and Denmark, maintain relatively even income distribution.
Equality and equity in income distribution
Equality and equity are distinct ideas when considering how income is shared in society. While equality means everyone receives the same, equity focuses on fairness, which can vary based on societal views.
Equality
Equality involves identical distribution of income or resources to all individuals, regardless of circumstances.
Equity
Equity refers to a fair distribution, which might not be equal but takes into account factors like needs or contributions. Different cultures have varying ideas of what counts as fair.
There is broad agreement that very high levels of inequality are unjust, but opinions differ on the ideal level of income distribution. Equity is often seen as reducing inequality in the portions of income that people receive, aiming for a more balanced society.
The Lorenz curve
The Lorenz curve is a visual tool used to illustrate how income is distributed across a population. It helps compare actual distributions against a scenario of perfect equality.
Features of the Lorenz curve
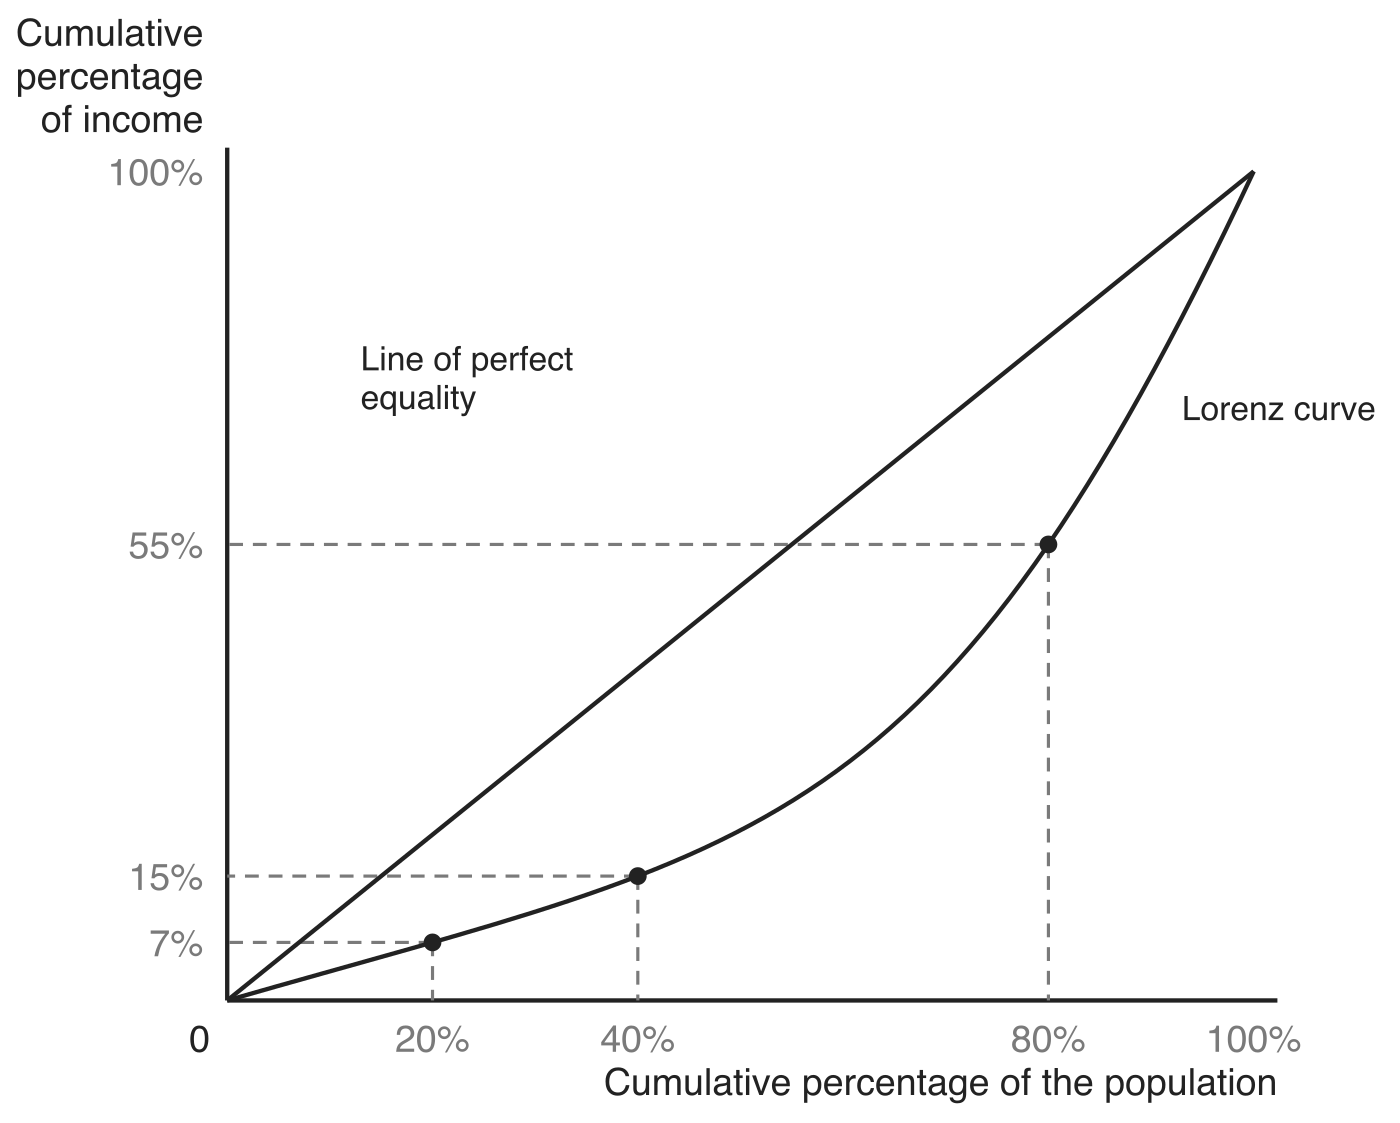
- The curve plots the cumulative percentage of the population (on the horizontal axis) against the cumulative percentage of total income they receive (on the vertical axis), and both axes run from 0 to 100%.
- The straight diagonal is the line of perfect equality, where each portion of the population receives the same share of income, so the poorest 20% would earn 20% of income and the poorest 40% would earn 40%.
- Greater income inequality causes the curve to bow further away from the diagonal line to the right.
- Reduced inequality moves the curve closer to the diagonal.
Reading the Lorenz curve in the diagram below against the axes gives the income share of each slice of the population. The poorest 20% of people receive only 7% of national income and the poorest 40% receive 15%, while the poorest 80% receive 55%, which leaves 45% of national income for the richest 20%.
Constructing a Lorenz curve
Lorenz curves are built using data on income shares, often divided into quintiles (groups of 20% of the population). This shows the cumulative income received by increasing percentages of the population, from the lowest earners upwards.
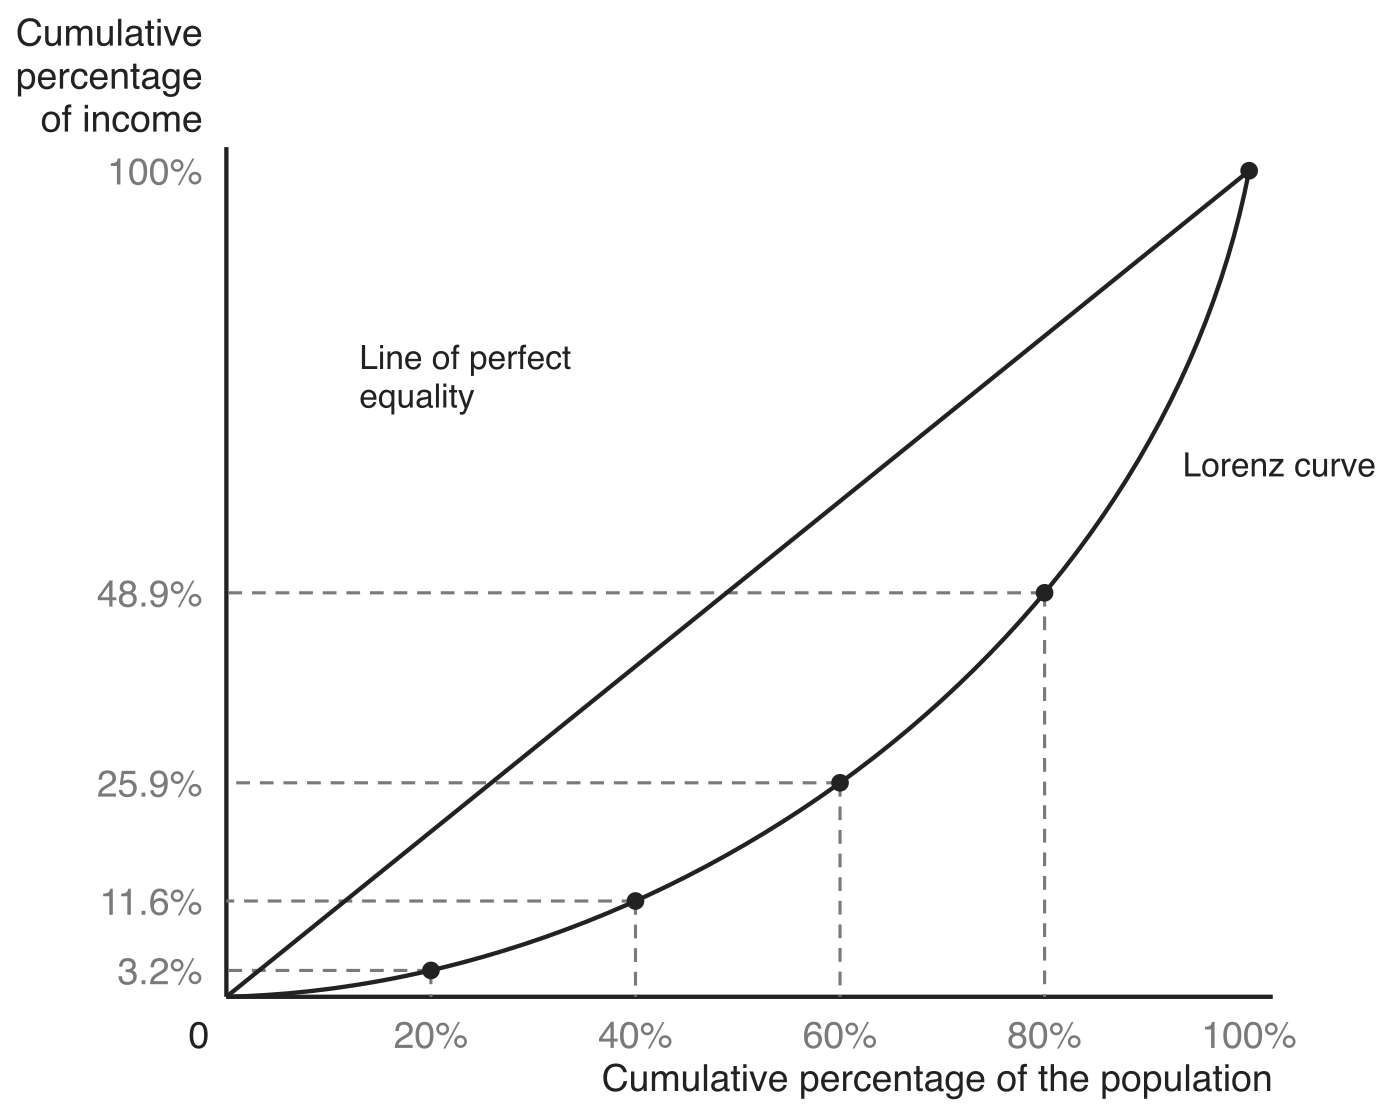
The table below gives the share of total income earned by each quintile in one economy in 2018. The lowest 20% is the first quintile, the second 20% is the next lowest, and so on.
| Year | Lowest 20% | Second 20% | Third 20% | Fourth 20% | Highest 20% |
|---|---|---|---|---|---|
| 2018 | 3.2 | 8.4 | 14.3 | 23.0 | 51.1 |
All figures are percentages of total income.
Each point on the curve adds the next quintile to the running total. The lowest 20% receives 3.2% of total income, which gives the first point. Adding the second quintile takes the lowest 40% to 11.6% (3.2% + 8.4%), the third takes the lowest 60% to 25.9% (11.6% + 14.3%), and the fourth takes the lowest 80% to 48.9% (25.9% + 23.0%). Adding the fifth quintile brings the total to 100% (48.9% + 51.1%), so the last point always shows 100% of households receiving 100% of the income, where the curve meets the line of perfect equality.
The Gini coefficient and global inequality
The Gini coefficient provides a numerical measure of income inequality, derived from the Lorenz curve. It summarises the degree of inequality in a single value.
Formula for the Gini coefficient
Where:
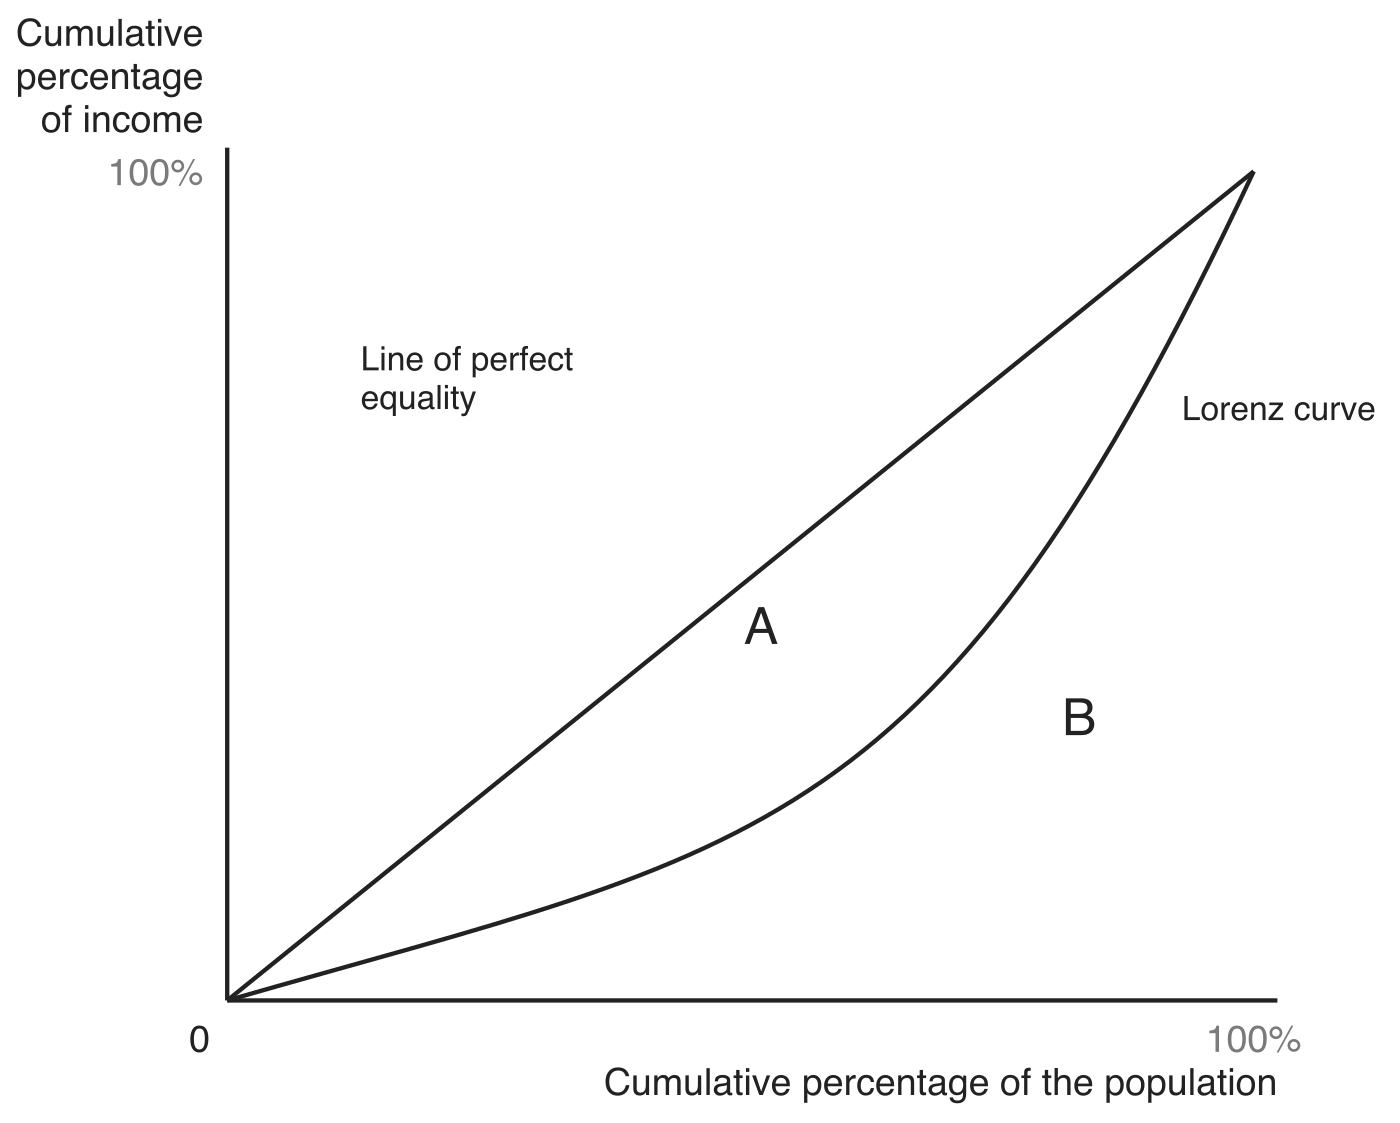
- Area A = The space between the Lorenz curve and the line of perfect equality
- Area B = The space below the Lorenz curve up to the bottom-right corner of the graph
The diagram below shows the two areas. Both axes run to 100%, so area A and area B together make up the whole triangle beneath the line of perfect equality. The further the Lorenz curve bows away from the diagonal, the larger area A becomes relative to area B, and the higher the Gini coefficient.
Interpreting the Gini coefficient
- Values range from 0 (complete equality, where everyone has the same income) to 1 (extreme inequality, where one person has all the income).
- Typical real-world values fall between 0.25 and 0.60.
- Low Gini coefficients appear in Northern European countries like Sweden, Norway, Denmark, and Austria, indicating more even distributions.
- High Gini coefficients occur in places like Lesotho, South Africa, and parts of Latin America.
- Among advanced economies, the USA has relatively high income inequality, with its Gini coefficient rising from 0.397 in 1967 to 0.488 in 2024.
- China's Gini coefficient is reaching 0.50, reflecting increasing inequality.